Quantified Anything: Turning Google Sheets into a Backend Database
The Google Docs suite is great, it offers real-time collaboration and near-feature parity with Microsoft Office (except maybe PowerPoint). One of my favorite things to do is track things, and a Google Sheets (think Excel) is perfect for the task.
The question that no one is asking but I am going to answer is... "Can I use Google Sheets as a backend database to power a website?" Yes, of course you can! Today we will lay out the groundwork on this technique and continue the fine tradition of using something on the internet for something other than its intended purpose.
Setup
First things first, let's create the spreadsheet that will drive our application. Bear with me, there is a lot going on.
Log into Google Drive and create a new Google Sheets.

I want to populate my data with a simple form, so I am going to hook in a form by selecting Tools→Create a form.

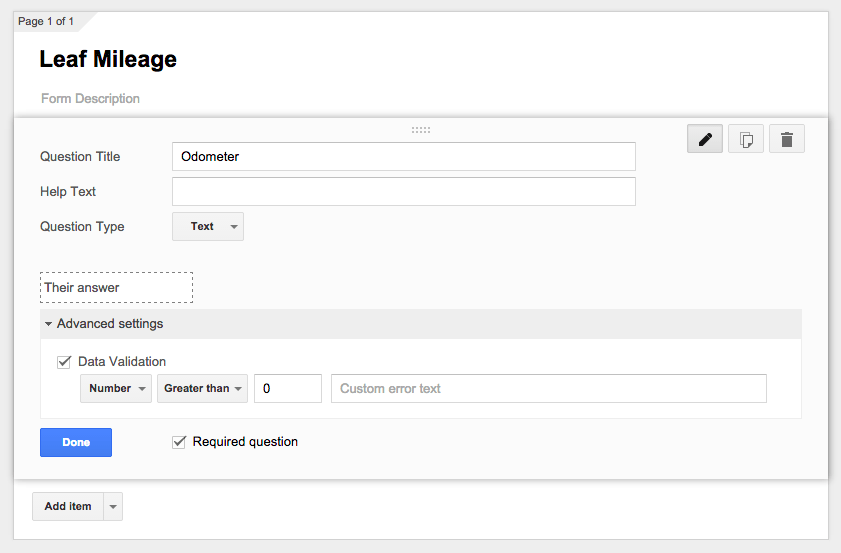
This is going to be a simple, one question form with data validation.

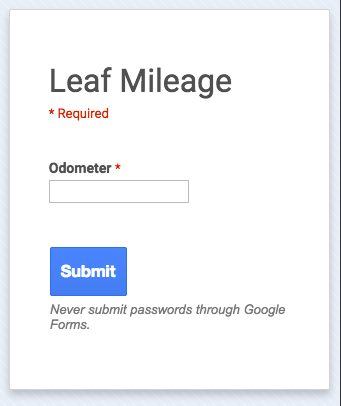
Now I have a very simple way to populate my spreadsheet from my iPhone when I am in my car looking at my odometer.

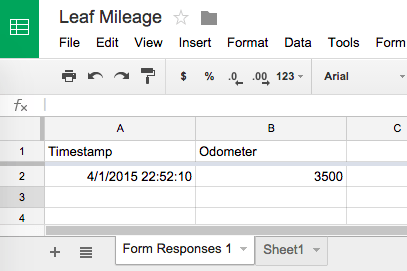
Each time I use the form, the timestamp and odometer reading will get put into my spreadsheet automatically.

Just a couple more housekeeping items while we are in our spreadsheet. Go to File→Publish to the web and then click publish.

Next, go to File→Share and click on the sharable link, this will turn on sharing for anyone with the link.

Feel free to take a peek at my spreadsheet.
If you look closely at the url, you will be able to find the spreadsheet's key. This is the longish value between the d/ and /edit. My key is 1e4bE5Xk1w1d-N3-xWCYk9ilUA2kFn2TH629lrT_w-Gk.

You now have all the pieces you need for your website to pull in your spreadsheet's data as JSON, the universal language of the internet's APIs (or at least my preferred one).
To access your sheet's data as JSON you need to point your browser at https://spreadsheets.google.com/feeds/list/{{yourkey}}/1/public/basic?alt=json-in-script&callback=JSON_CALLBACK, where you replace {{yourkey}} with your key. Keep this url in your back pocket because you will need it shortly. Here is mine.
If your url does not look like mine, you are using an old version of sheets, or the sheet was created before you upgraded. You can still use this technique, but your JSON url will look like this instead: https://spreadsheets.google.com/feeds/list/{{yourkeyhere}}/od6/public/basic?hl=en_US&alt=json and you can find the key by looking in your sheet's url https://docs.google.com/spreadsheet/ccc?key={{thisiswhereyourkeyis}}#gid=0.
If you do not see raw JSON that looks like the image below when you visit the JSON url, you are going to have a problem. You need to make sure you have your spreadsheet published, and you have your key correct. This endpoint is not well documented, so you could also try changing the /1/ to /2/, I think that piece refers to the "sheet" within your "spreadsheet", with /1/ being the leftmost sheet.

Pulling in the data
Now that we can see the data in JSON, lets get our webpage to see it. If we use jQuery, we can see the data pretty fast.
$.ajax({
  url:'https://spreadsheets.google.com/feeds/list/1e4bE5Xk1w1d-N3-xWCYk9ilUA2kFn2TH629lrT_w-Gk/1/public/basic?alt=json',
  success: function(data){
    console.log(data);
  }
});
Check out this jsFiddle, and change the variable JSONURL to your JSON url instead of mine, press run and watch your data fill the screen. A keen observer will notice that we have drilled into the huge JSON object and picked out only the actual cells and their data with this bit of javascript:
var cells = data.feed.entry;
However, this result is still pretty gnarly, so let's turn each row into a nice JSON object. We need to dig into the obscure data.feed.entry array and create a clean rows variable. The code is quite fragile, for example a comma in your number formats will break this particular loop. I recommend using underscore.js to clean it up a bit.
var rows = [];
var cells = data.feed.entry;

for (var i = 0; i < cells.length; i++){
  var rowObj = {};
  rowObj.timestamp = cells[i].title.$t;
  var rowCols = cells[i].content.$t.split(',');
  for (var j = 0; j < rowCols.length; j++){
    var keyVal = rowCols[j].split(':');
    rowObj[keyVal[0].trim()] = keyVal[1].trim();
  }
  rows.push(rowObj);
}
See it in action with this jsFiddle.
Now that we have a nice clean JSON object to play with, let's clean it up a bit.
Displaying the data
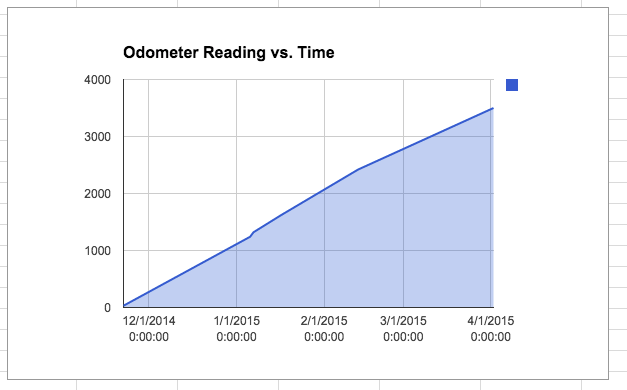
By using the awesome MetricsGraphics.js library, built on top of D3, we can have a chart in just a few more lines of javascript. See the fiddle for the updated code.

Voila! We are now pulling the data from Google sheets, which was populated by a simple mobile-ready form, turning it into a sane JSON object, and visualizing it in chart form.
I know what you are thinking at this point, why would you go through all of this rigmarole just to do something that Google Sheets does natively?

It is true, charts are free, but imagine the possibilities! Plus you can style it however you want.
Other (dumb) ways you can use this new-found power:
- Set up a shared form where all of your friends input their favorite GIF urls, your webpage could randomly cycle through them.
- You could keep a list of all of the places you have visited, and what you did there. Use the MapBox api to display them as an interactive journaling map.
- A list of books you have read displayed as an awesome timeline.
What are you going to do with this technique? Let us know in the comments.
We have demonstrated that it is indeed possible to create a webpage that uses Google docs as its "backend", but should we be doing this? Well, it is free, simple, offers the ability for real-time updates from multiple people, no mysql wizards necessary. On the downside it is slow. Like really slow. I used this technique to visually track my runs, and it can take up to ten seconds to fetch and parse the data. For hackathons and personal projects this is a great way to see data. For anything serious, you are going to want a real database on hand.
Back To All Posts?